PyPI User Research
A brief summary of the recent user research conducted for pypi.org
Along with user testing, user research is an important part of developing robust user experiences. Truly understanding your users - what motivates them, what they want, and how they use your product or website is essential for making better design decisions.
Conducting User Research for PyPI
As PyPI is an open-source project we don’t have the time (or money) to conduct individual user interviews, develop user personas, deeply analyse our Google Analytics data, or run discovery workshops with PyPI users. In the short-term, it’s necessary to find a way of collecting information about what the community wants, using a method that is fast, low-cost and engaging.
Currently, the page that we’d like to improve the most is the project detail page (view example). This page contains an invidual project’s README, history, files and other data. It is the most visited page type on the site and the interface we receive the most design feedback about.
Depending on the project, there can be a lot of information on this page. To maximise the potential of our redesign, it is important to understand how much our users value each piece of information in relation to the rest of the content.
Approach
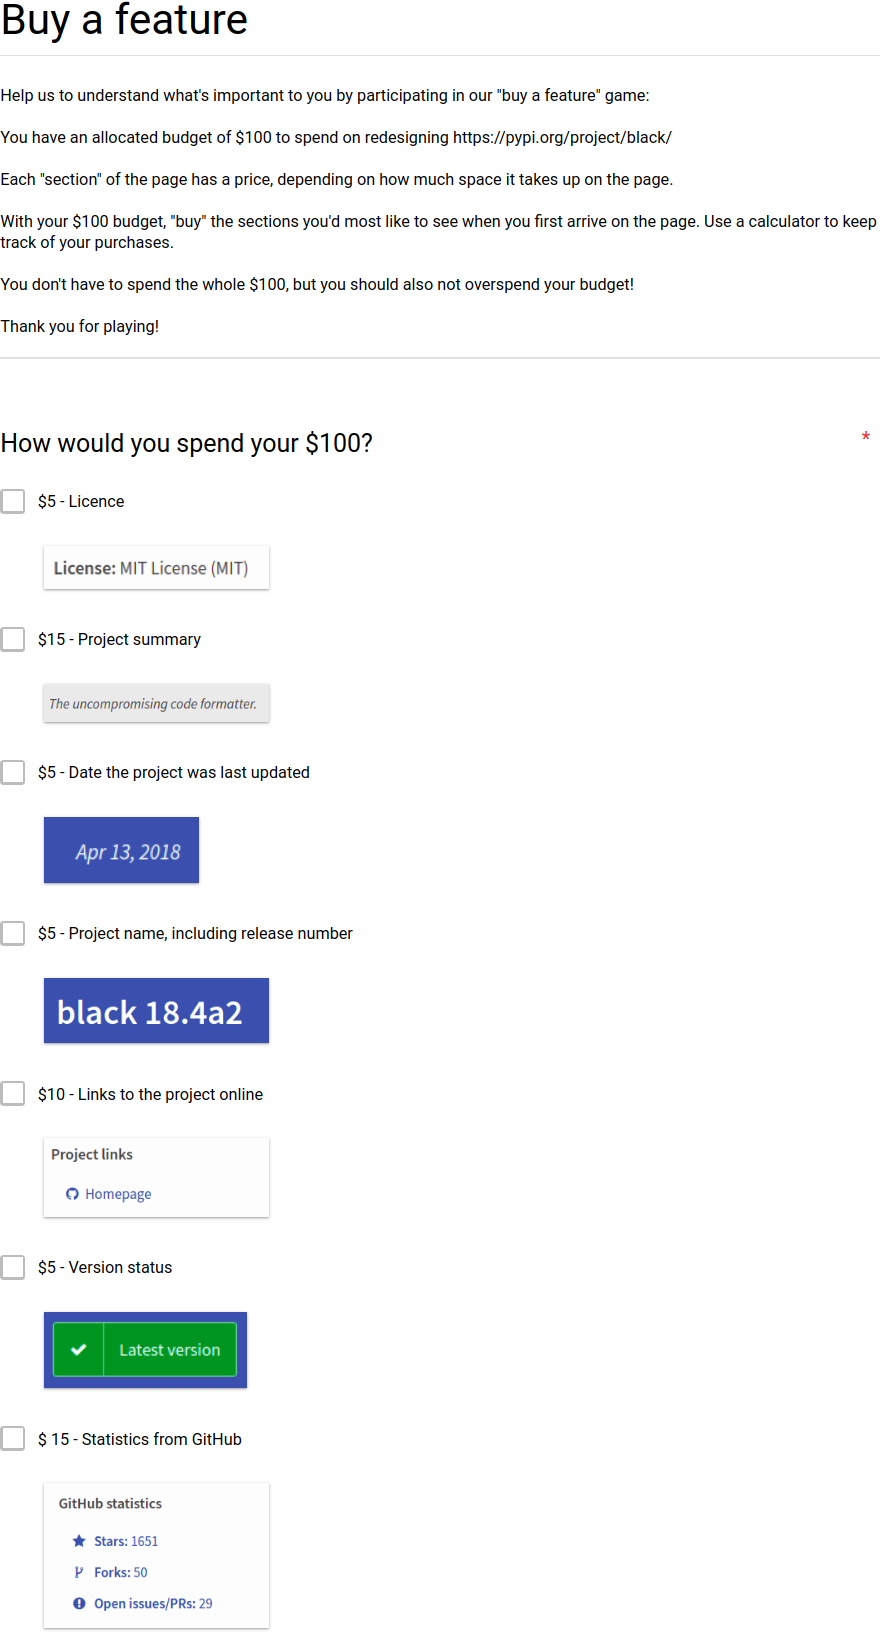
To discover what the community thinks, I set up a “Buy a Feature” form. This form was based off the “Buy a Feature” game that is typically run as a workshop.
The idea was to price each feature on the current page according to the space it takes up on the screen and then allocate a limited budget to each participant. Participants then use that budget to buy the features they want to see. I also added a wildcard item, to allow community members to request new features. The resulting data should indicate the overall priorities of the research participants.

Limitations
No research method is perfect, and there were certainly limitations to this exercise:
- Both the pricing and the budget were subjective.
- Participants may have chosen a lower priced item to use all of their allocated budget, even if this item was not their ideal choice.
- As the Google Form contained no budget validation, we relied on trust (and good mathematics!) to ensure participants didn’t overspend their budget.
Results
In total, 1,926 people participated in the exercise. Here are the results:
Participants = Total number of participants who selected this feature
Percentage = Percentage of participants who selected this feature
| Feature | Participants | Percentage |
|---|---|---|
| Project description | 1466 | 76.19% |
| Required Python version | 1349 | 70% |
| Links to project online | 1337 | 69.4% |
| Date project last updated | 1235 | 64.1% |
| Licence | 1059 | 55% |
| Project name and release no. | 1001 | 52% |
| Version status | 854 | 44.3% |
| Release history | 813 | 42.2% |
| GitHub statistics | 780 | 40.5% |
| Project summary | 752 | 39% |
| Requires distribution | 647 | 33.6% |
| Download files | 638 | 33.1% |
| Author | 619 | 32.1% |
| Tags | 461 | 23.9% |
| Trove classifiers | 441 | 22.9% |
| Maintainers | 424 | 22% |
| Statistics instructions | 266 | 13.8% |
| Wildcard (new feature) | 157 | 8.2% |
157 people chose to purchase a wildcard item - meaning that they forfeited some of their budget to request something different. I am in the process of moving these suggestions into our issue tracker. The full list can be viewed here.
Next Steps
In the coming months, we will continue to conduct user tests to qualify the results of this research, and identify flaws in the current interface.
After this, I will work to propose a new interface that responds to our discoveries, in an effort to better serve the Python community.
